The conversation: a domain expert, a prompt, and live security data infrastructure
On a recent call with Christopher Glyer, we were showing Mach5 security data infrastructure. Christopher described research he had done around the xz supply-chain backdoor: starting from public GitHub event dumps, he analyzed activity associated with JiaT75 over a long window and used timing signals to estimate where the actor might have been working from.
The striking part was not only the hypothesis. It was the workflow. Christopher's original investigation required roughly 30 hours of hands-on data preparation and analysis. During the call, we opened Codex CLI, connected it to the Mach5 MCP server, and issued prompts in the same way a security expert would describe the problem: pull this GitHub CSV, ingest it, build an app, analyze activity times, score likely time zones and countries, compare public holidays, then add more signals to narrow the result.
The goal was not to prove a person's location. The goal was to show how quickly Mach5 can turn a subject-matter expert's investigative idea into a repeatable security data workload with evidence, caveats, and drill-down paths.
By the end of the session Mach5 had created the application. It contained raw event exploration, dashboards, scoring tables, and a second-pass location model. The entire path from prompt to working app took about 30 minutes.
Step 1: fetch the data, normalize it, and make it queryable
The first prompt asked Mach5 to create an app that pulled GitHub data from the public xz backdoor research repository. The session started with the Tukaani project CSV, then switched to the JiaT75-specific file: jiat75_github.csv.
Mach5 inspected the source file, detected a ClickHouse-style type row after the CSV header, and handled quoted multiline fields correctly. A raw line count suggested 11,823 lines, but the parsed logical record count was 1,278 because comment bodies contained embedded newlines. The loader normalized dates, numbers, booleans, list-like fields, and generated stable document IDs so the ingest could be re-run safely.
What Mach5 created
- A managed index:
xz_jiat75_github_events - 1,278 parsed GitHub activity records
- 34 repositories, including 934 events in
tukaani-project/xz - 629 push events and 72 pull request events
- An app model with list, detail, navigation, and AI assistant actions
Step 2: build the investigation app
Once the events were indexed, Mach5 generated a declarative application around the data. The app was not a throwaway notebook; it became a reusable investigation interface with dashboards, filtered event queues, record detail pages, and AI helpers for event summarization and natural-language filtering.
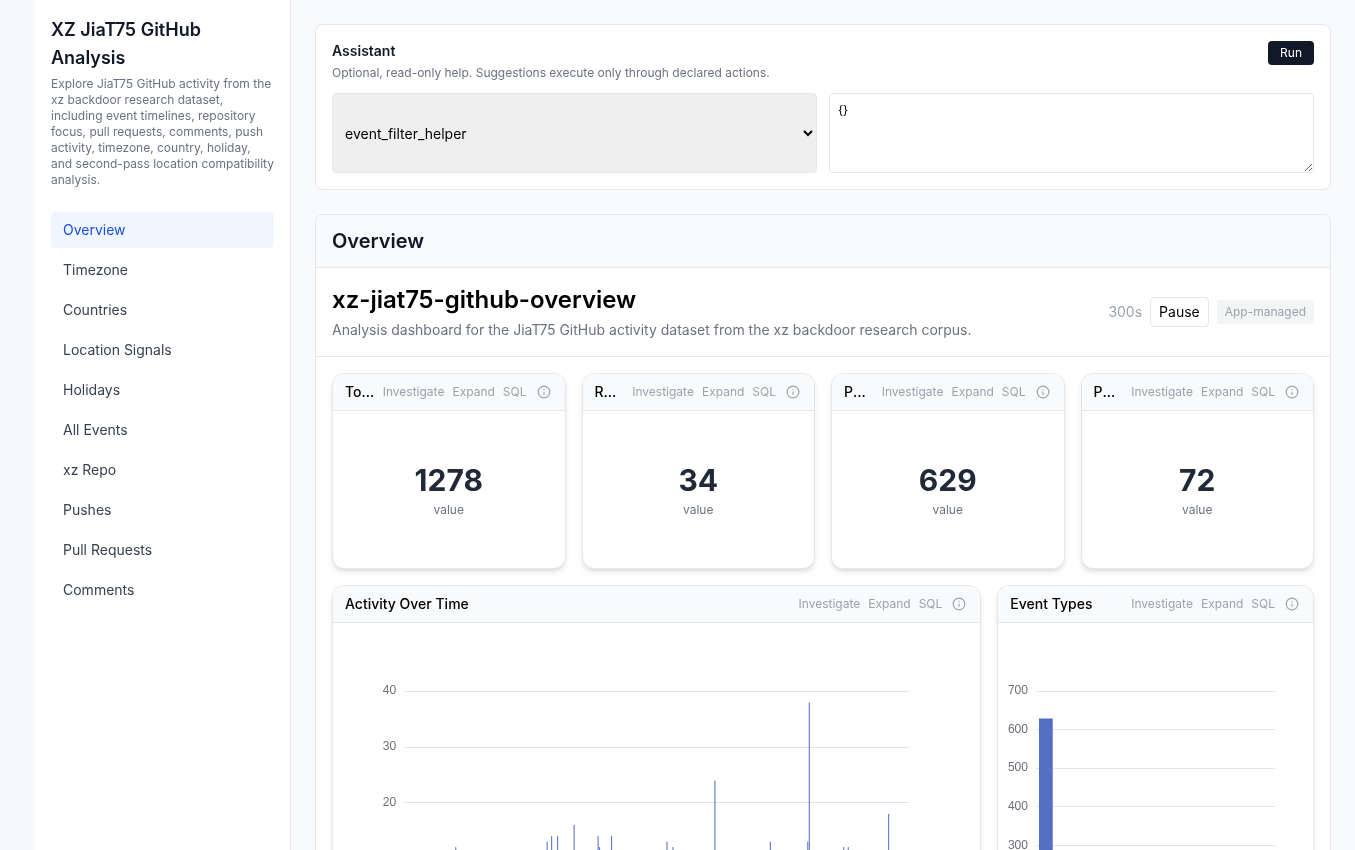
Overview page: KPI cards, activity over time, event type distribution, top repositories, actions, and recent events.
The app navigation included pages for Overview, Timezone, Countries, Location Signals, Holidays, All Events, xz Repo, Pushes, Pull Requests, and Comments. The list pages kept the raw evidence close to the derived conclusions: every score could be backed by event rows, timestamps, repository names, actions, comments, and source metadata.
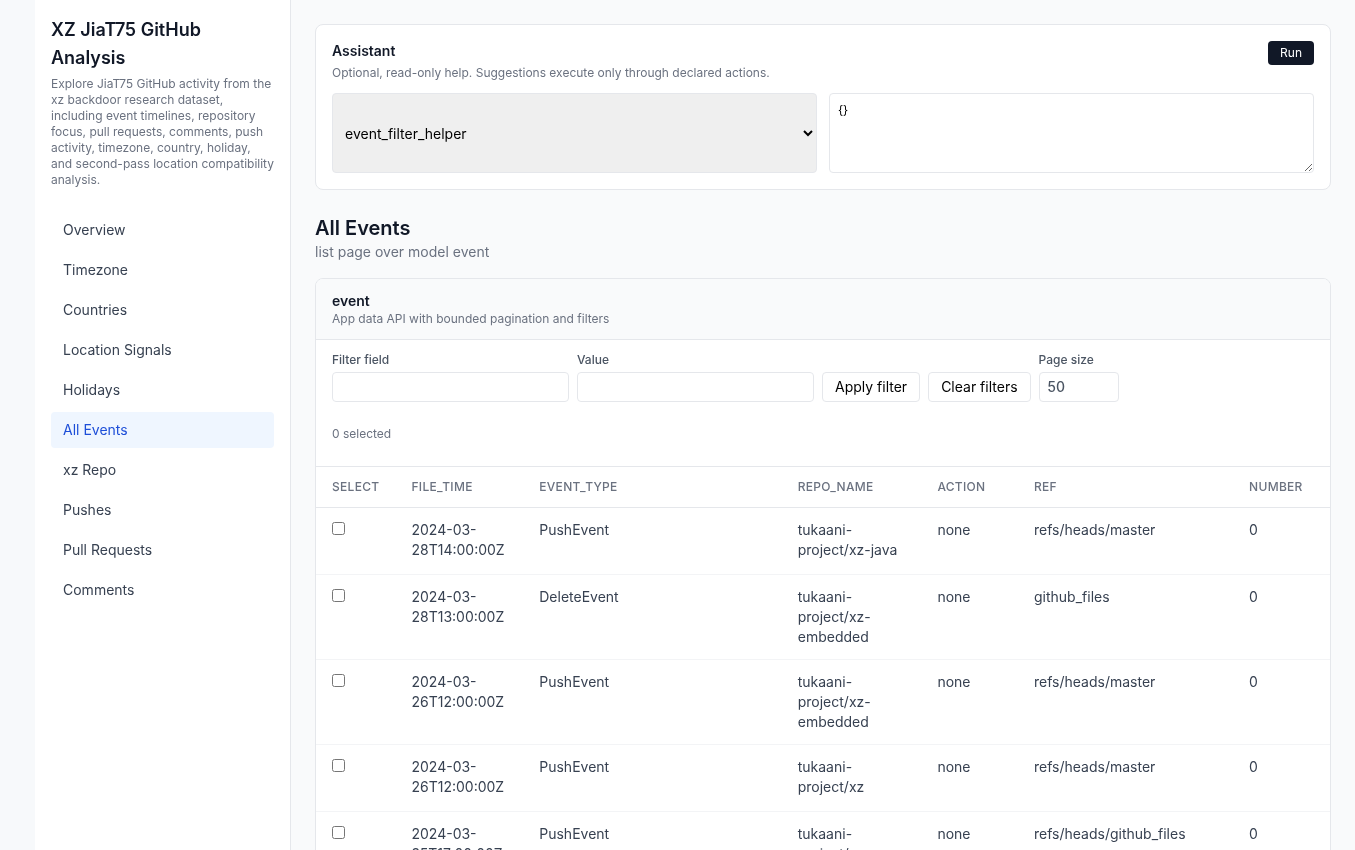
All Events page: the raw activity remains available for review and drill-down.
Step 3: turn expert hypotheses into scored analyses
Timezone inference
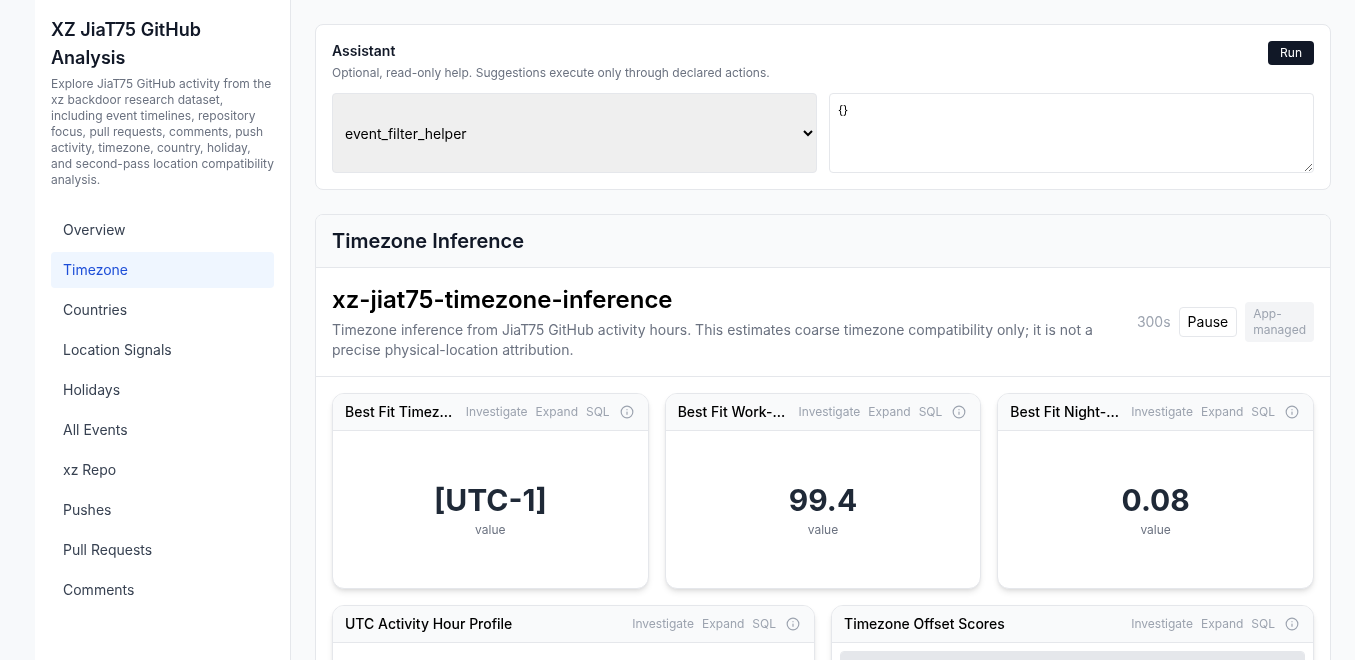
Christopher's core question was whether the actor's public GitHub activity could reveal a plausible working timezone. Mach5 extracted the UTC hour distribution from the event timestamps and scored candidate UTC offsets against simple human assumptions: activity should cluster in waking hours, should avoid deep night, and may align with conventional work hours.
The first-pass result was a coarse timezone band, not a country. The best-fit offsets clustered around UTC-3 to UTC+1, with the highest work-hour fit at UTC-1 and UTC+0. For UTC-1, 99.4% of events landed in local 09:00-17:00 under the model; UTC+0 scored 98.4%.
Country scoring
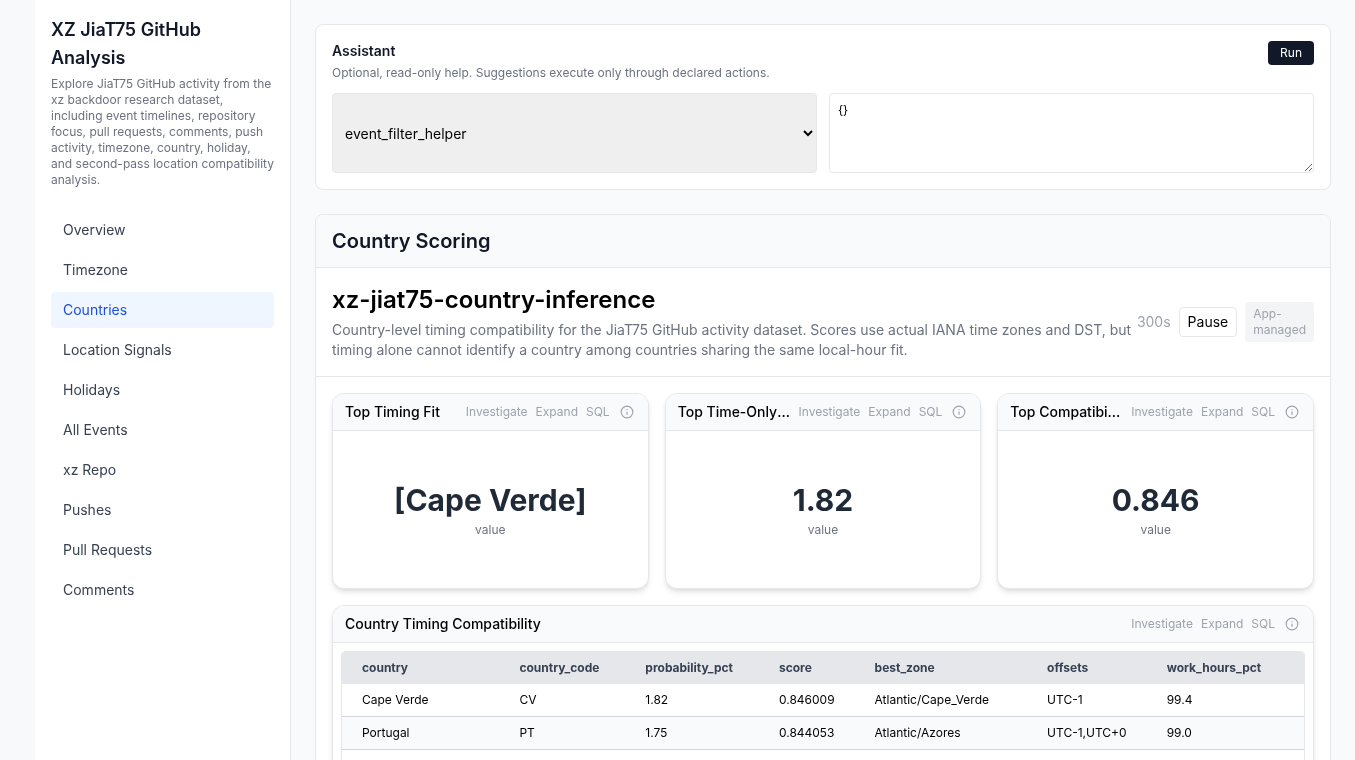
The next prompt asked Mach5 to score actual countries in those timezones. Mach5 used IANA time zone data and date-aware daylight-saving conversion, then produced a country compatibility index. The top time-only results were intentionally flat: Cape Verde, Greenland, Portugal, and many UTC+0 countries were close together. That was an important finding by itself. Timing strongly suggested a local-daytime band, but timing alone could not distinguish countries that share the same local-hour pattern.
Holiday and culture scoring
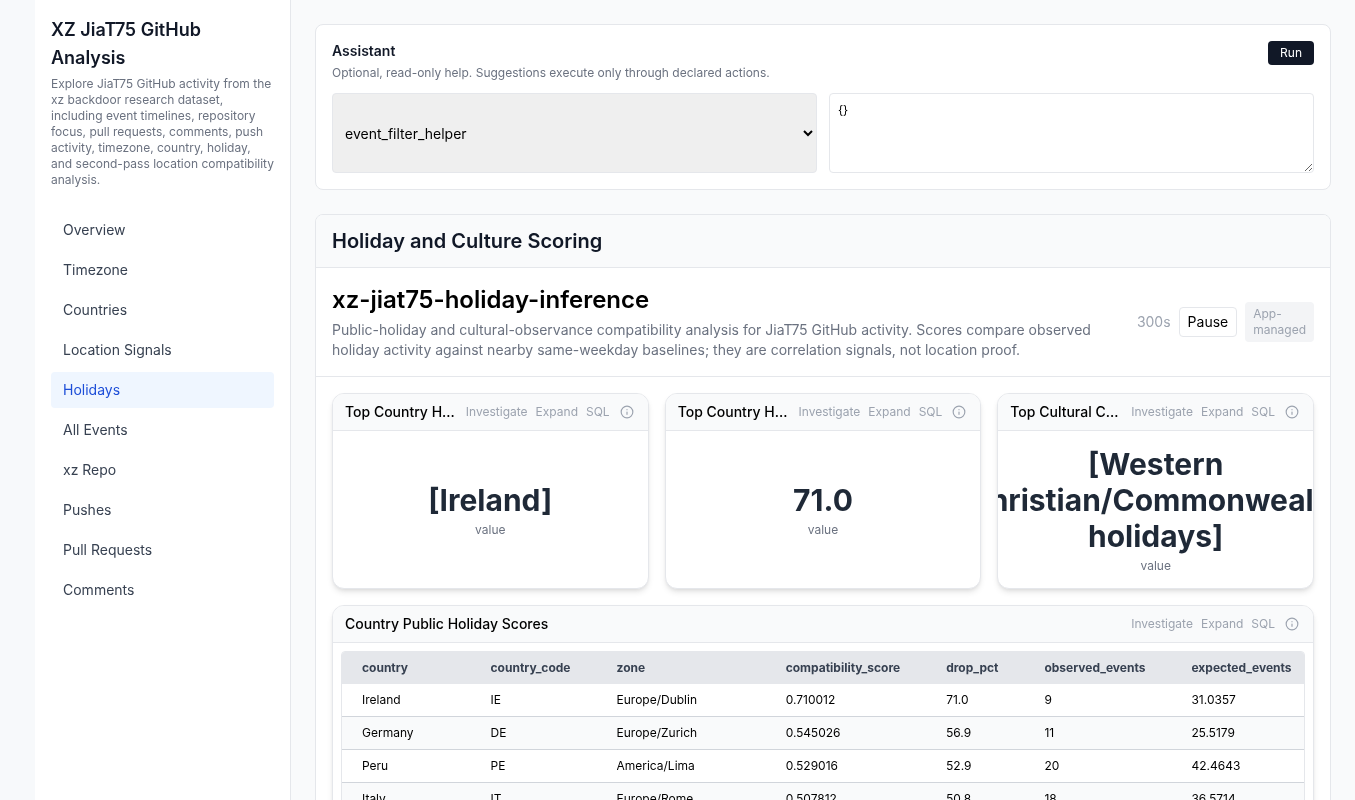
Christopher then described a second analysis: compare activity on common public holidays and cultural observances against nearby same-weekday baselines. Mach5 installed the needed calendar packages, generated country and cultural holiday calendars, scored observed activity against expected activity, and ingested the results into two new indexes.
This produced a different signal. The strongest holiday drops appeared in Western and European-style calendars. Ireland was the top public-holiday fit in that pass, with a 71% activity drop against the baseline; Germany, Italy, Netherlands, Austria, Denmark, and Czech Republic-style calendars also appeared high. The broad cultural calendar result pointed toward Western Christian/Commonwealth observances, while Islamic Eid, Lunar New Year, Diwali, and Jewish high-holiday windows did not show the same reduced activity pattern in this dataset.
Second-pass location signals
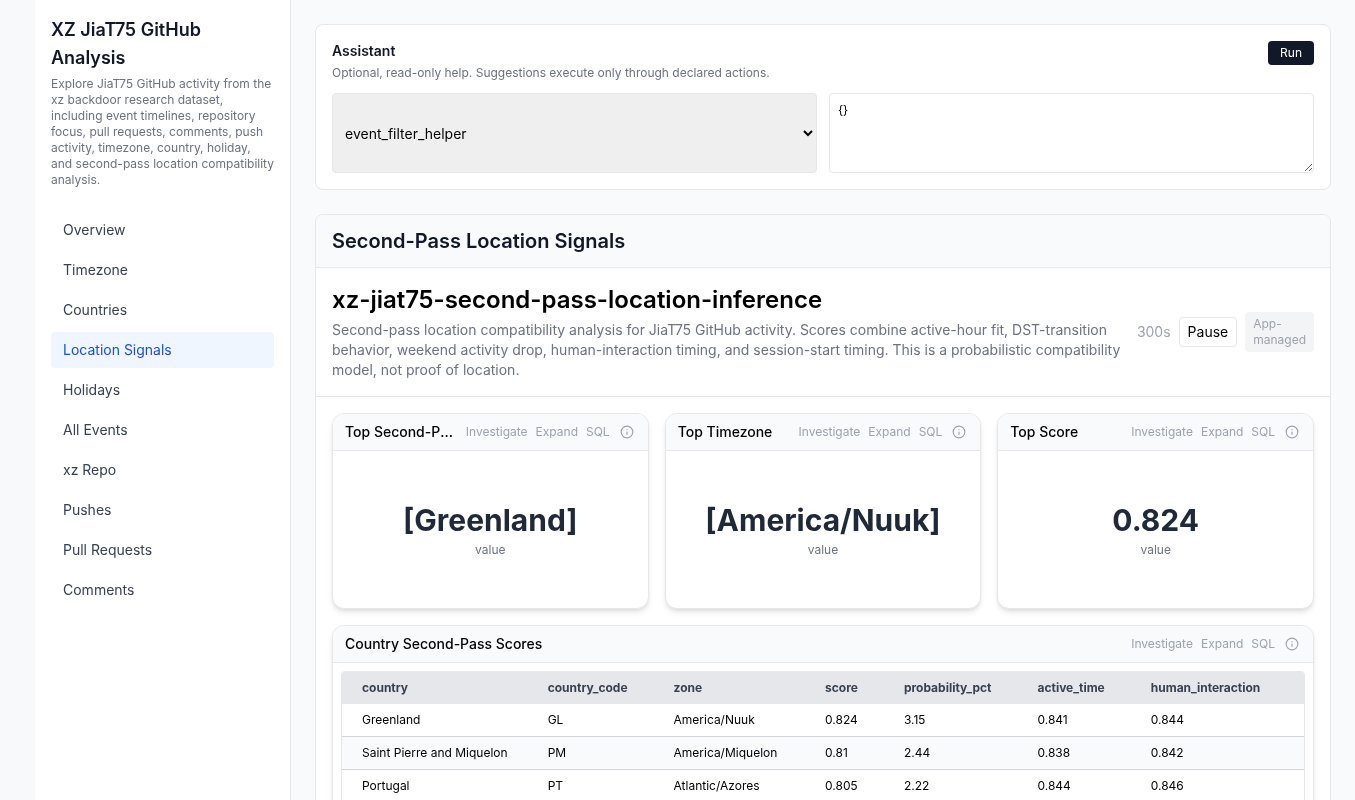
Finally, we asked Mach5 what else could narrow the result. It proposed and implemented a second-pass model combining active local-hour fit, DST-transition behavior, weekend definition, human-interaction timing, and session-start plausibility. That model created 247 country rows and 418 country/timezone rows. The top cluster shifted toward Atlantic and western-Europe-adjacent timezones: Greenland/Nuuk, Saint Pierre and Miquelon, Portugal/Azores, Canada/Newfoundland, Spain/Canary Islands, the UK, Ireland, and Faroe Islands.
Evidence-backed, but deliberately cautious
The app did not claim to identify a person, a city, or a precise location. That restraint matters. Public GitHub timestamps are noisy: pushes can be batched, work can be asynchronous, actors can travel, automation can run at scheduled times, and sophisticated operators can intentionally shape activity.
Mach5 therefore framed each result as a compatibility score. The evidence was transparent: scoring tables showed observed counts, expected baselines, work-hour shares, night-hour shares, DST components, weekend scores, and sample holidays. The user could inspect both the generated score indexes and the underlying event records.
What the data supported
- A strong daytime activity pattern around UTC-1/UTC+0.
- Reduced activity on Western/European-style holiday calendars.
- A Saturday/Sunday weekend signal stronger than Friday/Saturday alternatives.
- A practical cluster around Atlantic and western-Europe-adjacent timezones.
What the data did not prove
- A precise country, city, employer, or identity.
- That the top scoring country is literally the actor's location.
- That timing and holiday data are independent signals.
- That an adversary could not intentionally mimic another region.
The takeaway: the spec became the app
This is the experience Mach5 is designed for. A domain expert should not have to stop an investigation to become a data platform engineer. They should be able to describe the data, the hypotheses, and the evidence they want. Mach5 can then fetch the data, normalize it, create indexes, build dashboards, add app navigation, and preserve the reasoning as reusable artifacts.
In this session, simple prompts produced an end-to-end investigation workload: raw GitHub events, filtered event pages, timezone scoring, country scoring, holiday and culture scoring, and a second-pass model with DST and weekend signals. What took a domain expert more than 30 hours to assemble manually was reproduced live in roughly 30 minutes, with the evidence packaged into a working Mach5 workload.
That is the power of Mach5: it does not just answer a question once. It turns the question into an application that others can inspect, rerun, and extend.
Want to build this kind of investigation app?
Mach5 combines ingestion, indexing, SQL/MQL search, dashboards, Axon workflows, MCP tools, and declarative applications in one platform.