Dashboard concepts
Mach5 dashboards are persistent, namespaced resources made of query-backed panels on a grid canvas. Dashboards can be created manually, promoted from AI investigation, packaged in apps, or generated by automation.
Use dashboards when a team needs a durable view of operational data: summaries, trends, timelines, ranked lists, tables, maps, agent activity, or investigation evidence.
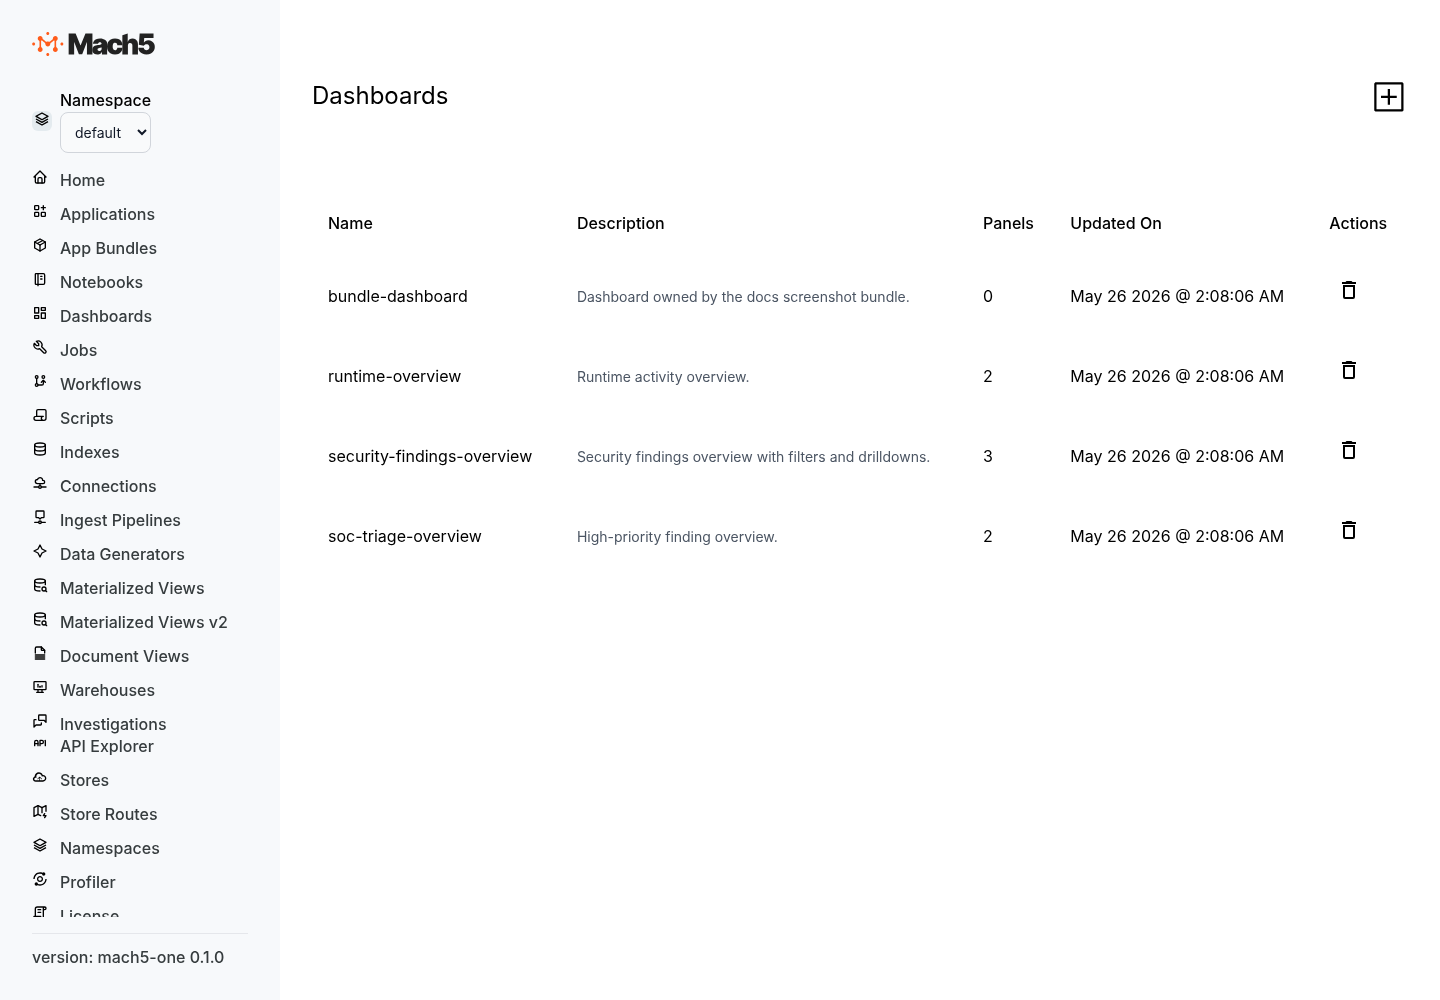
Dashboard structure
A dashboard has these top-level parts:
| Concept | Purpose |
|---|---|
| Metadata | Name, description, tags, and source information. |
| Refresh | Controls automatic dashboard refresh. |
| Time range | Optional shared time window for all panels. |
| Parameters | Shared inputs such as environment, service, user, severity, or time range. |
| Layout | Grid settings and optional tabs. |
| Panels | Query-backed visualizations. |
| Interactions | Click, select, cross-filter, drilldown, navigation, and URL actions. |
A minimal dashboard contains a description, layout, and at least one panel.
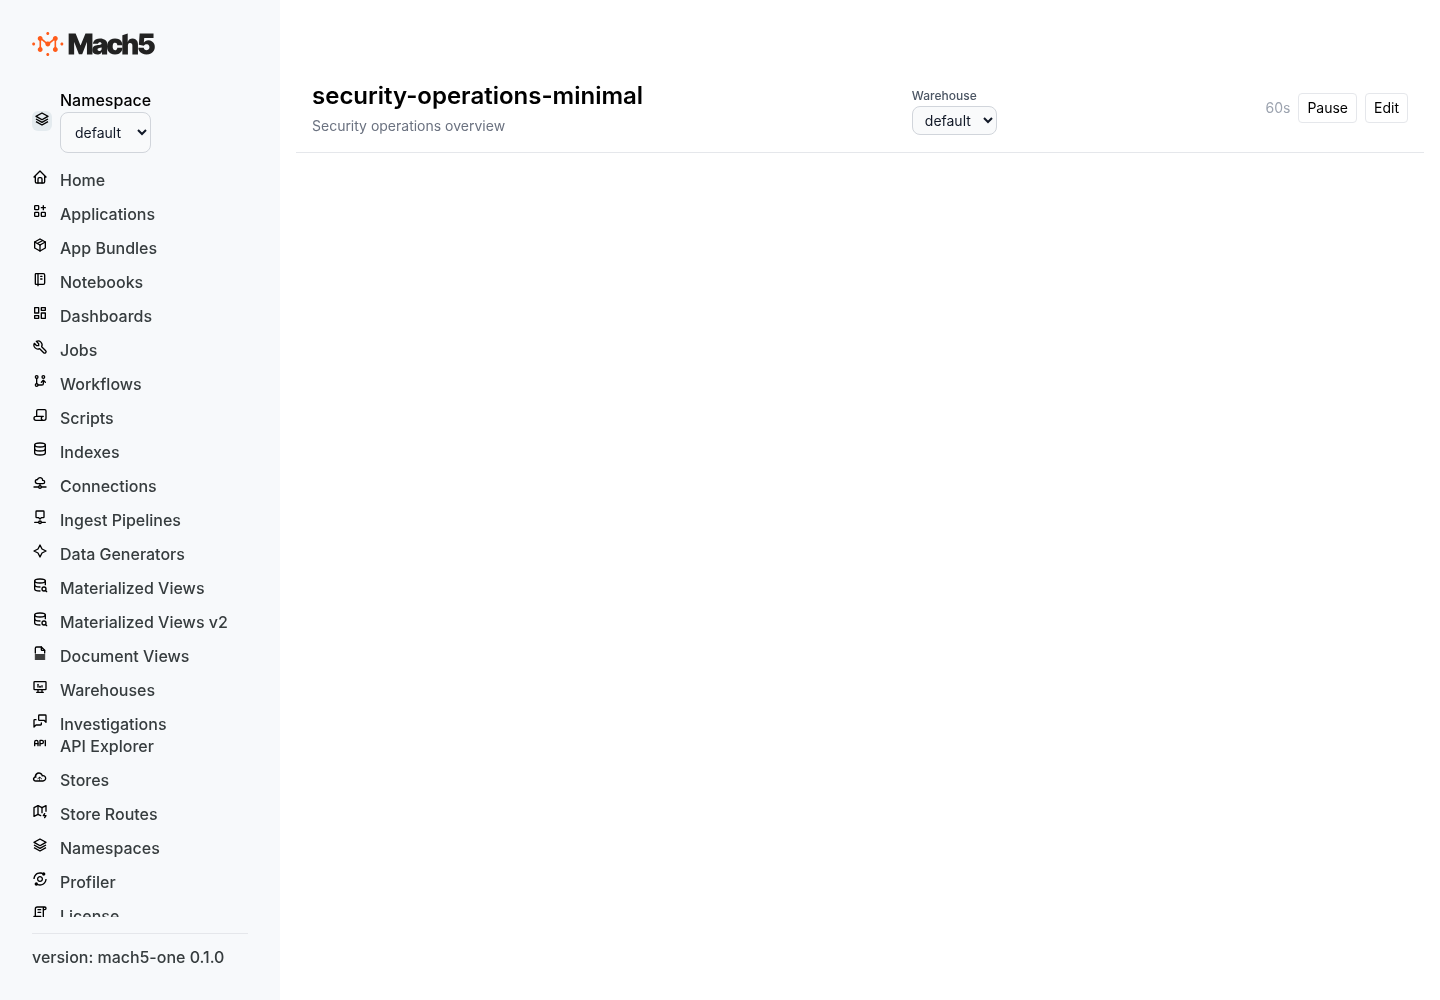
{
  "description": "Security operations overview",
  "tags": ["security", "operations"],
  "refresh": {
    "enabled": true,
    "interval_seconds": 60
  },
  "layout": {
    "columns": 24,
    "row_height": 30
  },
  "panels": []
}
Sources
The source field describes where the dashboard came from.
| Origin | Meaning |
|---|---|
manual | Created by a user or API call. |
promoted | Promoted from an AI investigation session. |
ai | Generated by AI. |
app | Shipped as part of a Mach5 app. |
{
  "source": {
    "origin": "app",
    "app_id": "agent-runtime-attribution"
  }
}
Promoted dashboards can preserve the investigation context:
{
  "source": {
    "origin": "promoted",
    "promoted_from": {
      "session_id": "sess_01J...",
      "turn_id": "turn_07"
    }
  }
}
Refresh
Refresh controls how often the dashboard updates while open.
{
  "refresh": {
    "enabled": true,
    "interval_seconds": 30
  }
}
Use shorter refresh intervals for live operations. Use longer intervals for expensive queries or historical dashboards.
Panels can override the dashboard refresh interval with refresh_override_seconds.
Time range
Dashboards can define a shared time range.
Relative time range:
{
  "time_range": {
    "mode": "relative",
    "value": 24,
    "unit": "hours"
  }
}
Absolute time range:
{
  "time_range": {
    "mode": "absolute",
    "from_epoch_ms": 1735689600000,
    "to_epoch_ms": 1735776000000
  }
}
Supported relative units are minutes, hours, days, and weeks.
Parameters and filters
Parameters are shared dashboard inputs. They power filters, panel query placeholders, drilldowns, and cross-filtering.
Supported parameter types:
| Type | Use it for |
|---|---|
time_range | Shared time picker. |
text | Free-form filter input. |
select | Single choice from static or query-backed options. |
multi_select | Multiple choices from static or query-backed options. |
number | Numeric threshold, limit, or score. |
Static select parameter:
{
  "name": "severity",
  "display_name": "Severity",
  "type": "select",
  "default_value": "high",
  "required": false,
  "config": {
    "kind": "select",
    "options": [
      { "value": "critical", "label": "Critical" },
      { "value": "high", "label": "High" },
      { "value": "medium", "label": "Medium" }
    ],
    "allow_custom": false
  }
}
Query-backed select parameter:
{
  "name": "service",
  "display_name": "Service",
  "type": "select",
  "config": {
    "kind": "select",
    "query": {
      "sql": "SELECT DISTINCT service AS value FROM runtime_events ORDER BY service",
      "value_column": "value",
      "label_column": "value",
      "refresh_on_dashboard_open": true
    }
  }
}
Number parameter:
{
  "name": "min_risk",
  "display_name": "Minimum risk",
  "type": "number",
  "default_value": "70",
  "config": {
    "kind": "number",
    "min": 0,
    "max": 100,
    "step": 5
  }
}
Text parameter:
{
  "name": "user_search",
  "display_name": "User search",
  "type": "text",
  "config": {
    "kind": "text",
    "placeholder": "alice@example.com"
  }
}
Layout
Dashboards use a grid layout. The default is 24 columns with a row height of 30 pixels.
{
  "layout": {
    "columns": 24,
    "row_height": 30,
    "tabs": [
      {
        "name": "Overview",
        "panel_ids": ["p_total_findings", "p_findings_over_time"]
      },
      {
        "name": "Evidence",
        "panel_ids": ["p_recent_events", "p_process_tree"]
      }
    ]
  }
}
Each panel defines its own position:
{
  "grid_pos": {
    "x": 0,
    "y": 0,
    "w": 8,
    "h": 4
  }
}
Panels
A panel combines a query, visualization, grid position, and optional interactions.
{
  "id": "p_total_findings",
  "title": "Total findings",
  "grid_pos": { "x": 0, "y": 0, "w": 6, "h": 4 },
  "query": {
    "source": {
      "type": "sql",
      "sql": "SELECT COUNT(*) AS total FROM findings WHERE severity = {{severity}}"
    },
    "parameter_bindings": [
      {
        "parameter_name": "severity",
        "query_placeholder": "{{severity}}"
      }
    ]
  },
  "visualization": {
    "type": "metric_card",
    "emphasis": "hero",
    "config": {
      "value_column": "total"
    }
  }
}
Query sources
Panels can query data through several sources.
| Query source | Use it for |
|---|---|
sql | SQL queries over Mach5 indexes, tables, or views. |
mql | MQL queries where MQL is preferred. |
opensearch | OpenSearch-compatible request bodies. |
app_query | Named queries packaged by a Mach5 app. |
notebook_cell | Reuse a notebook cell result. |
Visualizations
Supported visualization types include:
autodata_tabletime_chartcolumn_chartarea_chartpie_chartmetric_cardlevel_chartmapprocess_treenetwork_graphtimelinesummaryranked_listagent_run_listcommand_evidence_listsensitive_command_cataloglog_source_coveragenetwork_flow_list
Visualization emphasis controls sizing and prominence:
| Emphasis | Use it for |
|---|---|
hero | Top-level KPI or primary visualization. |
primary | Main dashboard panels. |
detail | Evidence or expanded detail panels. |
supporting | Context, helper tables, or secondary charts. |
Common visualization config fields:
| Field | Purpose |
|---|---|
group_by | Column used to group series or categories. |
max_series | Maximum number of series to render. |
columns | Columns to show in tables and evidence lists. |
value_column | Metric or value column. |
stacking | none, stack, or overlay. |
show_legend | Whether to show a legend. |
Interactions
Interactions make dashboards active. A panel can cross-filter another panel, open an investigation, navigate to another dashboard, or open an external URL.
Supported triggers:
| Trigger | Meaning |
|---|---|
click | User clicks a row, point, or value. |
select | User selects a value from a column. |
Supported actions:
| Action | Meaning |
|---|---|
cross_filter | Set a dashboard parameter from a selected value. |
drill_to_investigation | Open an AI investigation prompt. |
navigate_to_dashboard | Navigate to another dashboard with parameter mappings. |
open_url | Open an external URL from a template. |
Example cross-filter:
{
  "trigger": {
    "type": "select",
    "column": "service"
  },
  "action": {
    "type": "cross_filter",
    "target_parameter": "service",
    "value_from": "service"
  }
}
For full configuration examples, see Dashboard configuration.