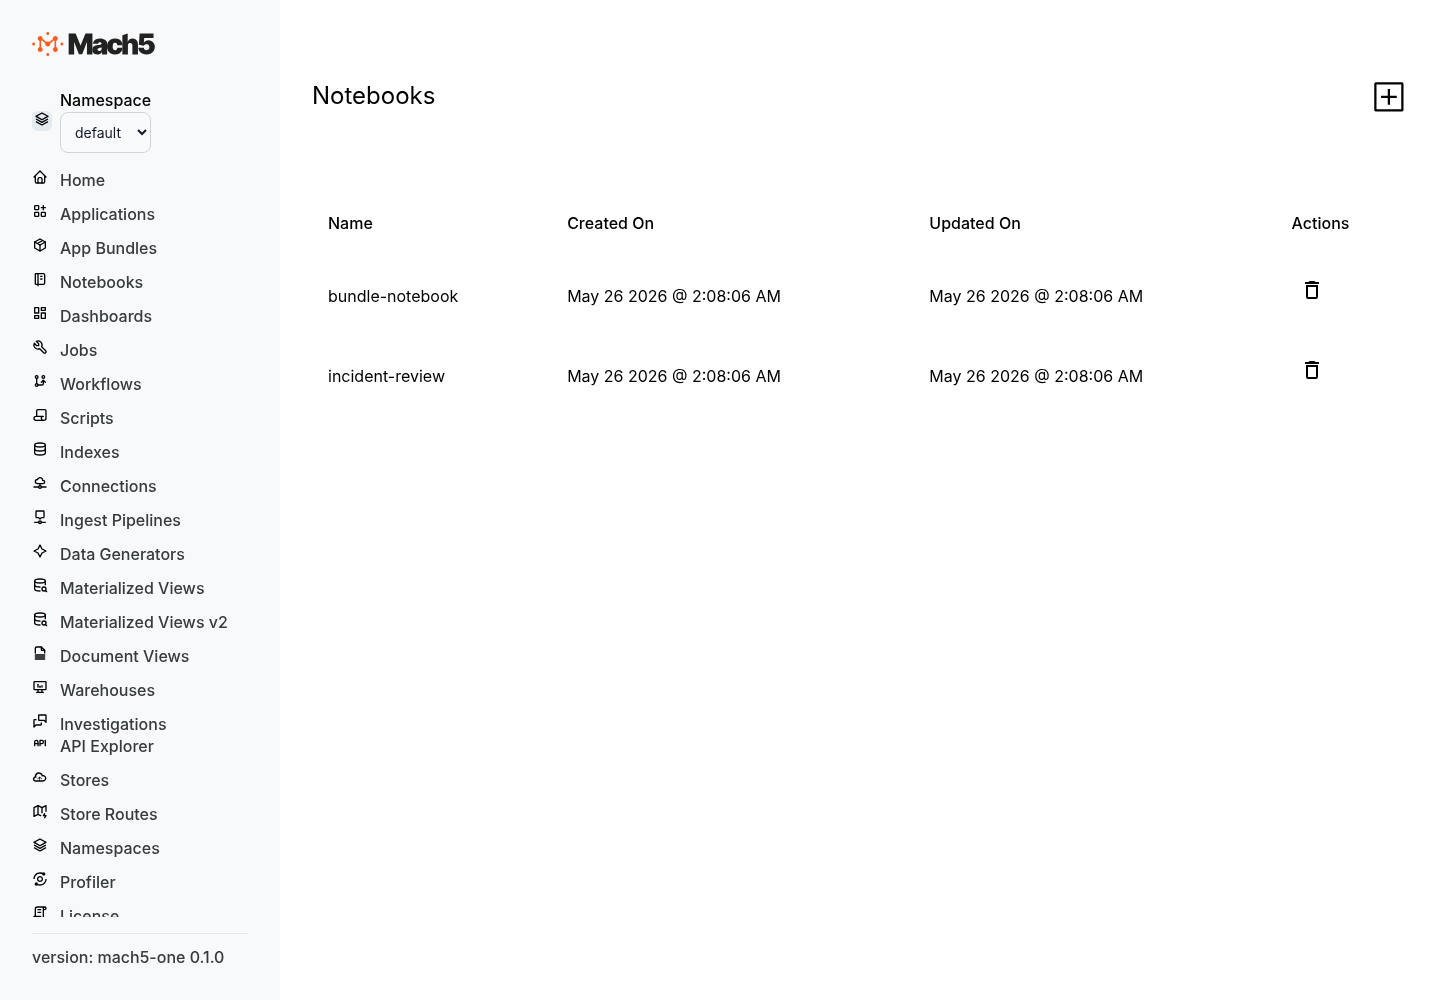
Notebook concepts
Mach5 notebooks are interactive workspaces for exploring data, testing queries, documenting analysis, and turning investigation steps into reusable assets.
Use notebooks when you want to work iteratively: write a query, inspect results, refine filters, visualize patterns, and keep the steps together for later review.
Core model
A notebook is a persistent resource with a format version, ordered cells, and metadata.
| Concept | Meaning |
|---|---|
| Notebook | A named workspace that stores analysis steps. |
| Cell | One executable or descriptive unit in a notebook. |
| Source | The cell content, stored as ordered source lines. |
| Metadata | Cell or notebook settings such as title, cell type, warehouse, visualization, and display options. |
| Result | Output produced when a cell runs. Results are shown under the cell in the UI. |
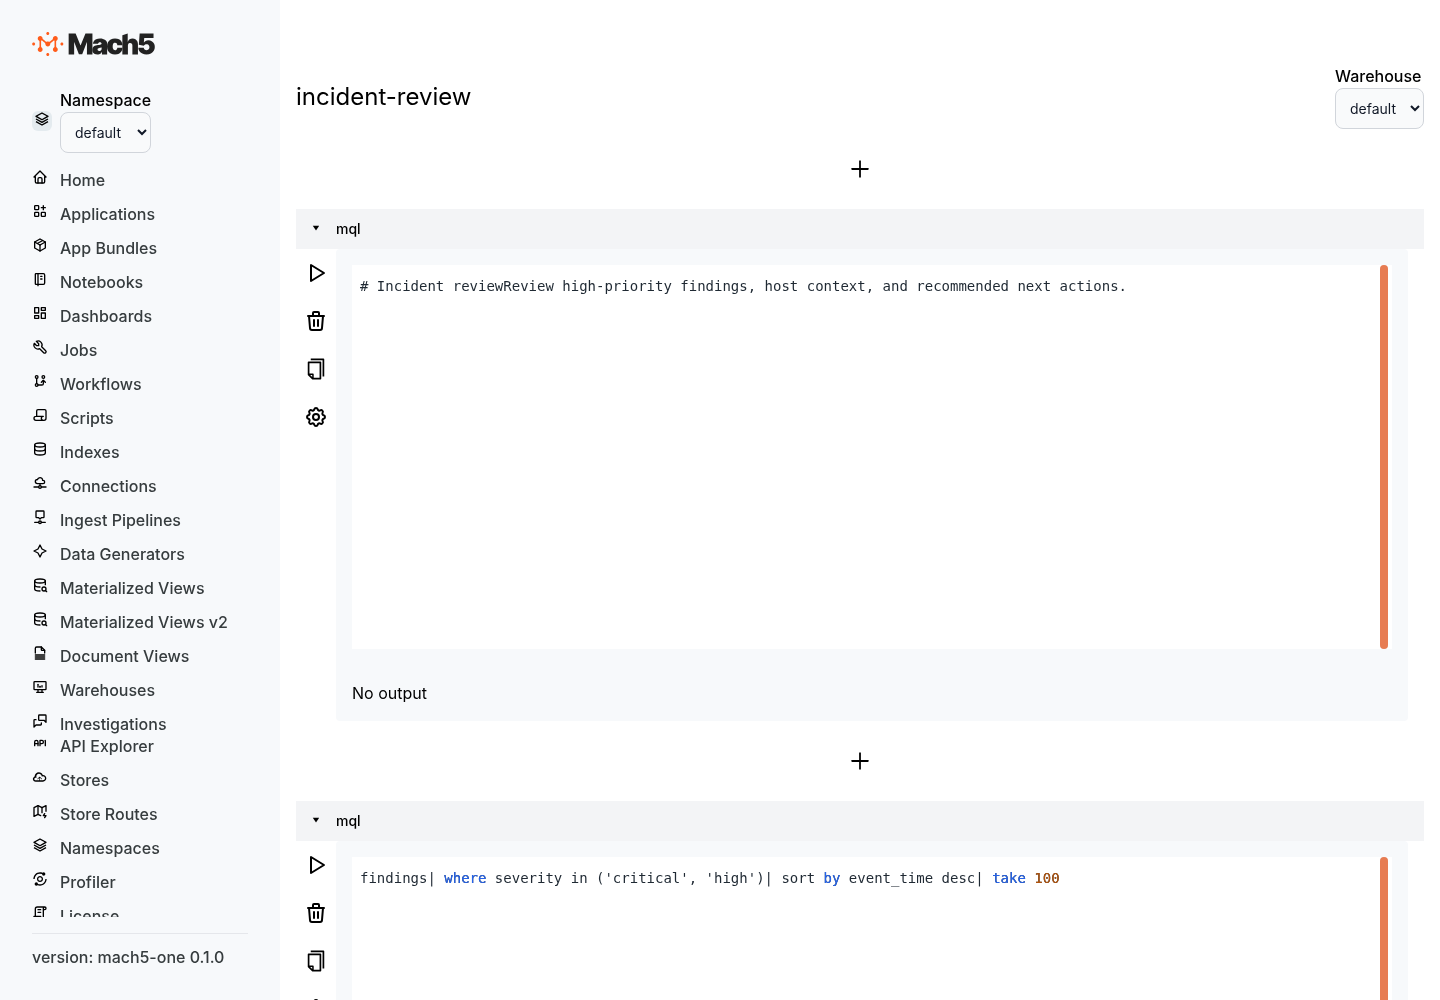
A minimal notebook resource looks like this:
{
  "name": "incident-review",
  "format_version": {
    "major": 1,
    "minor": 0
  },
  "metadata": {
    "description": "Notebook for reviewing incident evidence"
  },
  "cells": []
}
Notebook configuration
The notebook config has three top-level fields.
| Field | Type | Description |
|---|---|---|
format_version | object | Notebook format version. |
cells | array | Ordered list of notebook cells. |
metadata | object | Optional notebook-level metadata. |
{
  "format_version": { "major": 1, "minor": 0 },
  "metadata": {
    "title": "Agent activity review",
    "tags": ["security", "agents"],
    "default_warehouse": "localwarehouse"
  },
  "cells": []
}
Cell structure
Each cell has an ID, source lines, and metadata.
{
  "id": "cell_recent_agent_runs",
  "source": [
    "agent_runs",
    "| where status == 'completed'",
    "| take 100"
  ],
  "metadata": {
    "type": "mql",
    "title": "Recent agent runs",
    "warehouse": "localwarehouse"
  }
}
| Field | Type | Description |
|---|---|---|
id | string | Stable cell identifier. |
source | array of strings | Cell text stored line-by-line. |
metadata | object | Cell settings such as type, title, warehouse, index, time field, visualization, or filters. |
Cell types
Mach5 notebooks commonly use these cell types:
| Cell type | Purpose |
|---|---|
mql | Search, filter, aggregate, and render data with MQL. |
sql | Query Mach5 data with SQL where SQL notebooks are enabled. |
discover | Explore an index interactively with time charts, filters, and document inspection. |
markdown | Document assumptions, findings, next steps, and analyst notes where note cells are enabled. |
Cell type is stored in metadata:
{
  "metadata": {
    "type": "mql",
    "title": "Top services by finding count"
  }
}
MQL cells
MQL cells are useful for fast exploration over indexed data.
{
  "id": "cell_top_services",
  "source": [
    "findings",
    "| where severity in ('critical', 'high')",
    "| summarize count = count() by service",
    "| sort by count desc",
    "| take 20"
  ],
  "metadata": {
    "type": "mql",
    "title": "Top services by high-severity findings",
    "warehouse": "localwarehouse"
  }
}
MQL cells can include render to visualize results directly in the notebook.
findings
| summarize count = count() by severity
| render piechart
SQL cells
SQL cells are useful when you need joins, explicit projections, materialized views, or familiar SQL aggregation.
{
  "id": "cell_findings_by_hour",
  "source": [
    "SELECT date_trunc('hour', event_time) AS hour, severity, COUNT(*) AS count",
    "FROM findings",
    "WHERE event_time >= now() - interval '24 hours'",
    "GROUP BY hour, severity",
    "ORDER BY hour"
  ],
  "metadata": {
    "type": "sql",
    "title": "Findings by hour",
    "warehouse": "localwarehouse",
    "visualization": {
      "type": "time_chart",
      "group_by": "severity",
      "value_column": "count"
    }
  }
}
Discover cells
Discover cells are for interactive index exploration. They store index settings, time field, hit count, chunking behavior, and OpenSearch-compatible filters in metadata.
{
  "id": "cell_discover_runtime_events",
  "source": [],
  "metadata": {
    "type": "discover",
    "title": "Runtime events",
    "index": "runtime_events",
    "time_field": "event_time",
    "hits_size": 100,
    "enable_chunked": true,
    "filters": [
      {
        "match_phrase": {
          "event_type": "process_start"
        }
      }
    ]
  }
}
Filters
Filters narrow cell results. In query cells, filters are usually part of the query text. In Discover cells, filters are stored as OpenSearch-compatible query objects.
{
  "filters": [
    {
      "range": {
        "risk_score": {
          "gte": 80
        }
      }
    },
    {
      "match_phrase": {
        "environment": "prod"
      }
    }
  ]
}
Visualizations
Notebook cells can render charts through query syntax or metadata.
MQL render syntax:
findings
| summarize count = count() by severity
| render piechart
Metadata-driven visualization:
{
  "metadata": {
    "visualization": {
      "type": "column_chart",
      "group_by": "service",
      "value_column": "count",
      "show_legend": false
    }
  }
}
Notebooks and dashboards
Dashboards can reuse notebook cell output through a notebook_cell panel source.
{
  "source": {
    "type": "notebook_cell",
    "notebook_name": "incident-review",
    "cell_index": 3
  }
}
Use this when notebook analysis becomes important enough to monitor repeatedly. For dashboard panel details, see Dashboard configuration.
Best practices
- Use stable, descriptive cell IDs.
- Keep one question per cell.
- Put notes before complex queries so future readers understand intent.
- Use MQL for quick exploration and SQL for joins or structured analysis.
- Store repeated filters in query text or Discover metadata.
- Promote high-value notebook cells into dashboard panels.
- Keep notebooks short enough to rerun and review.